User Tools
system_data
This is an old revision of the document!
System Plots
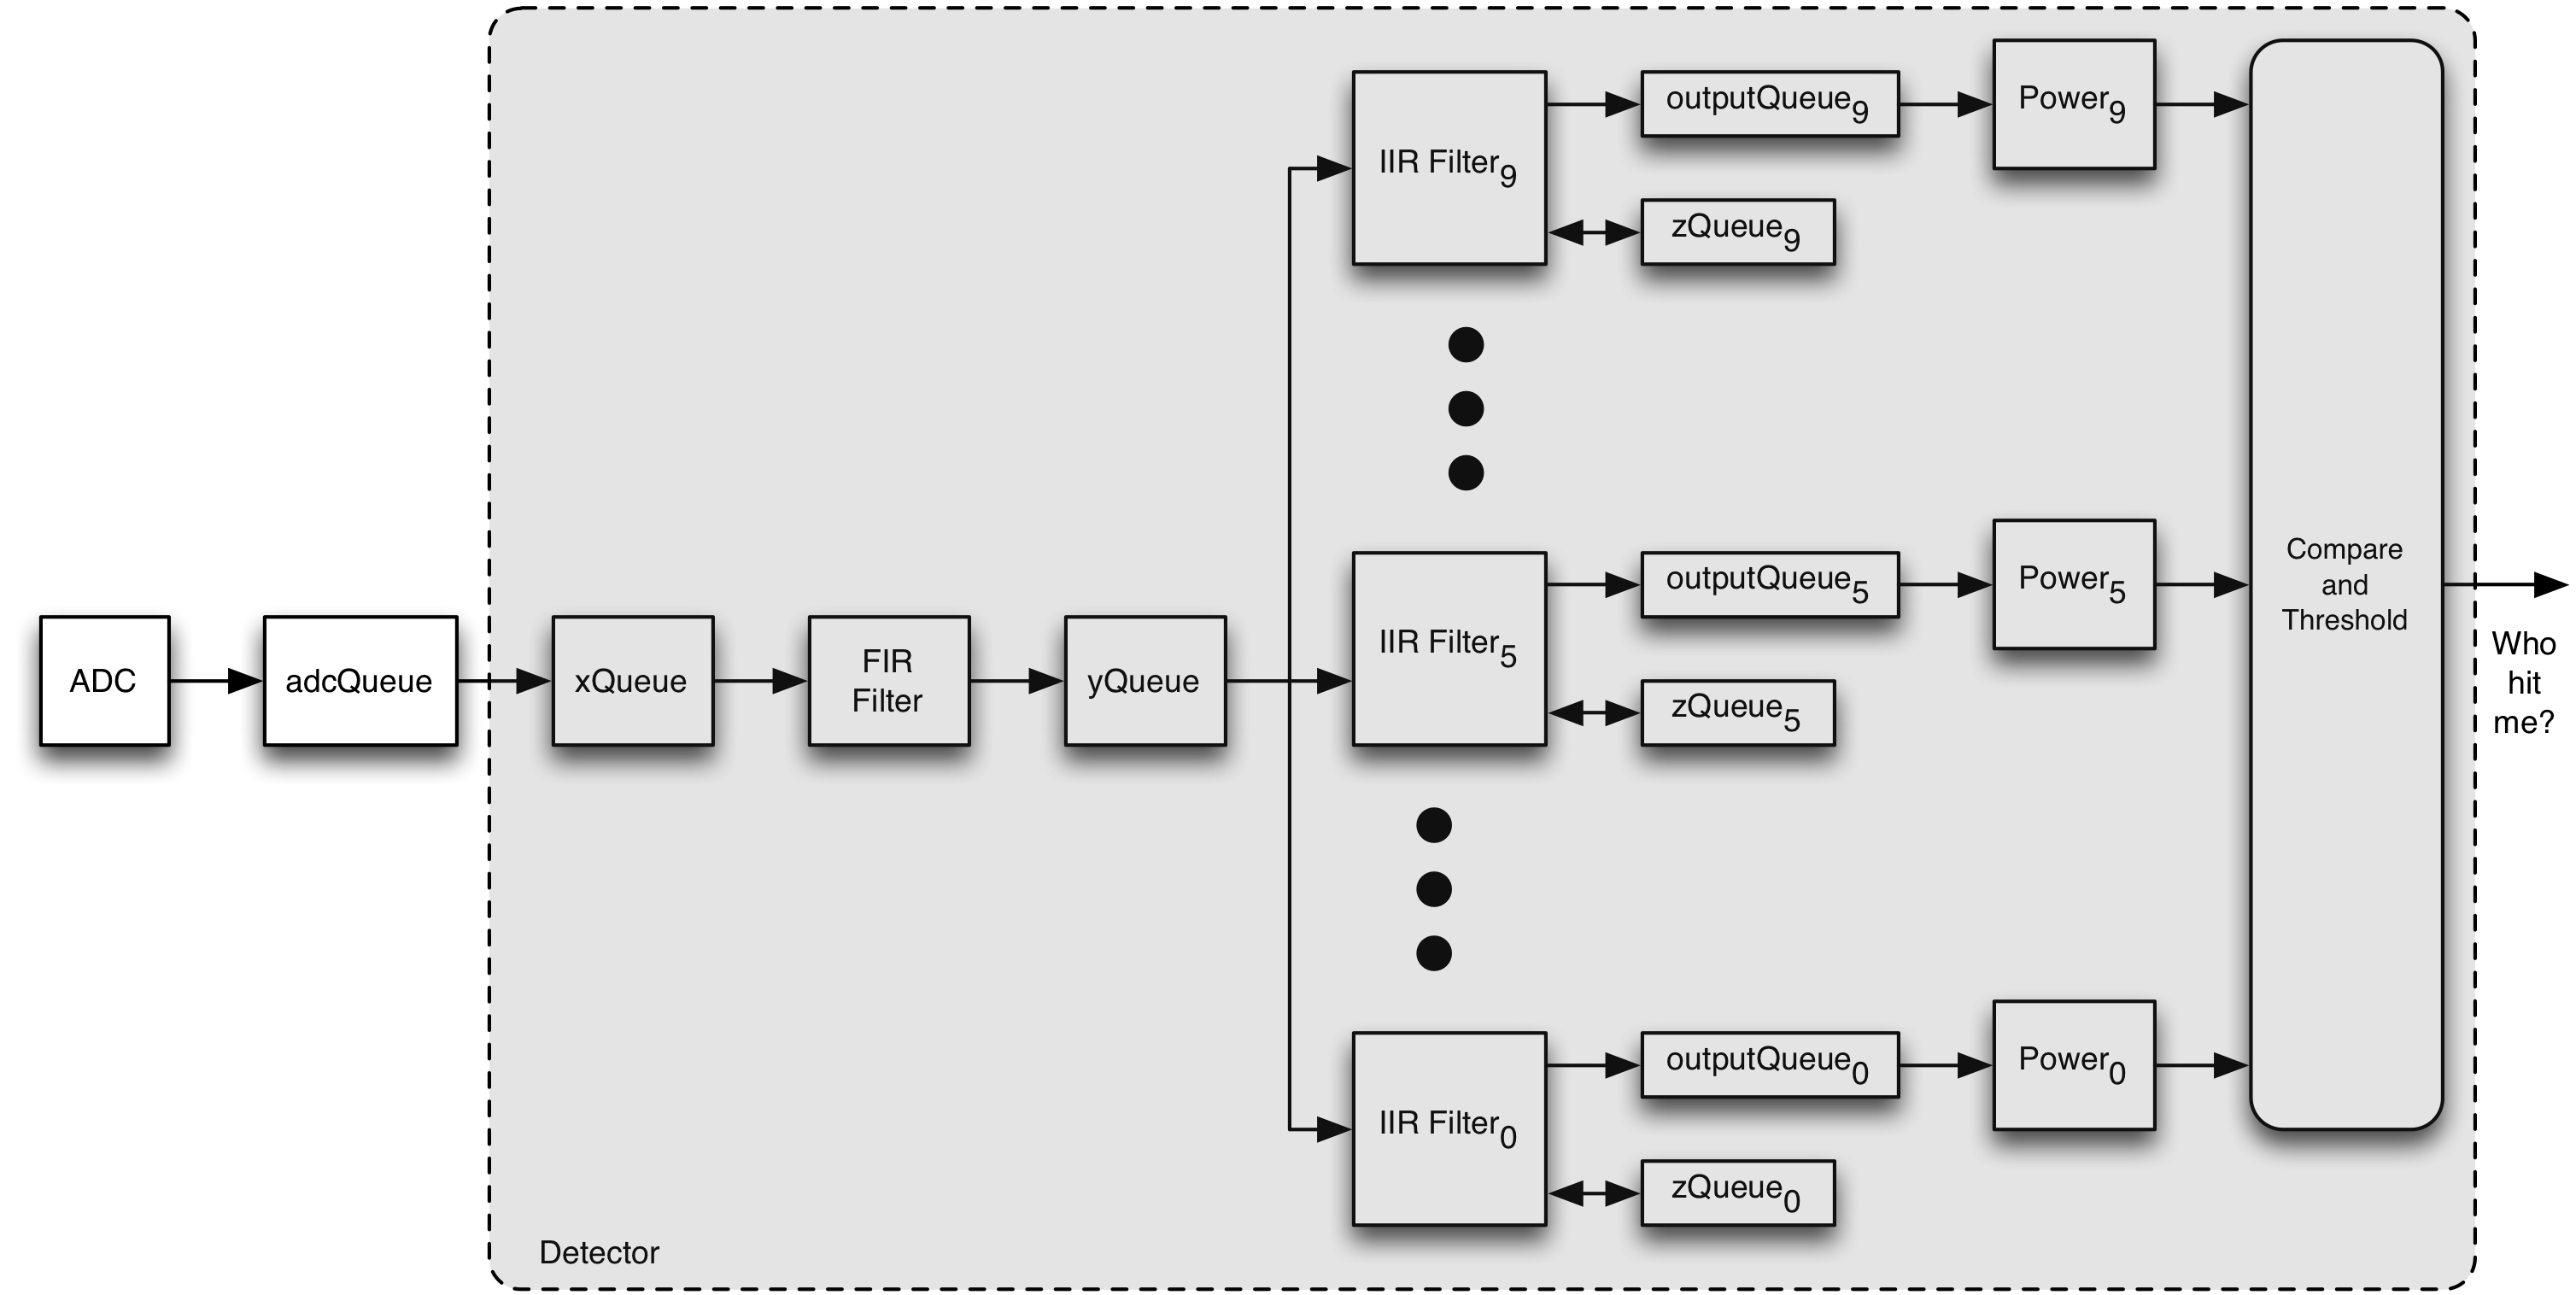
This is basic block diagram of the system.
The basic process is the following:
- Read numbers from the receiver board using the ADC at a rate of FS=100 kHz
- Low pass filter the samples (using an FIR filter)
- Down sample the data to a rate of FS=10 kHz
- Filter the data through the 10 bandpass filters (using 10 IIR filters)
- Compute a running power
To better understand this process let's look
Low pass filtering We are going to start by looking at a very short time scale in order to easily see what things look like a t
system_data.1423604482.txt.gz · Last modified: 2015/02/10 14:41 by schultz


