User Tools
This is an old revision of the document!
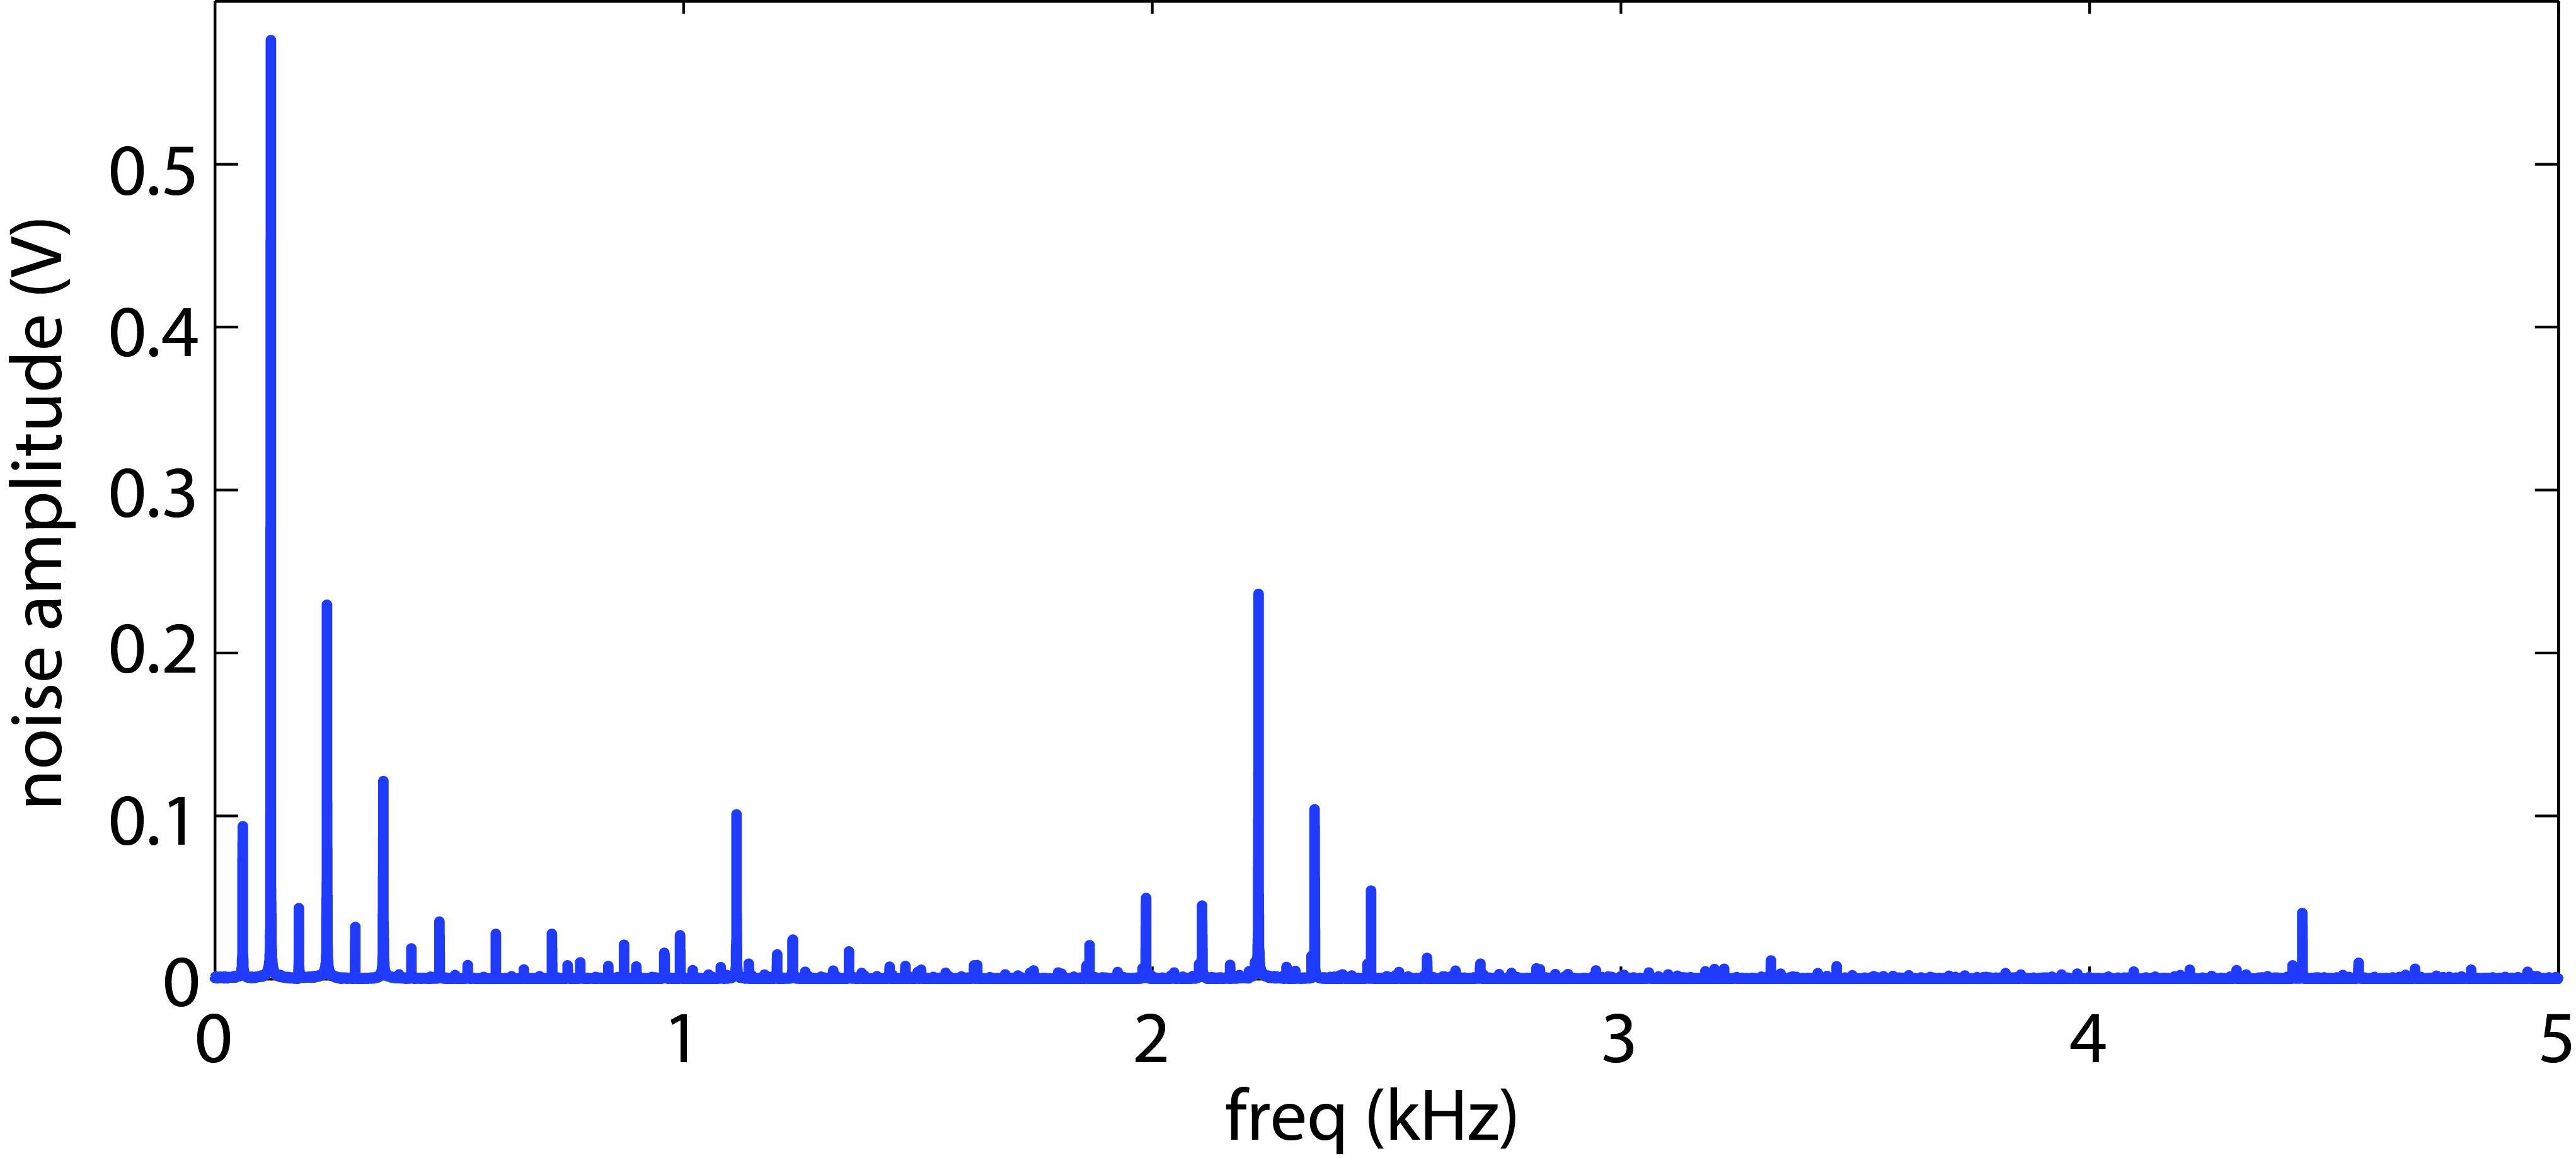
We decided to use a sample rate of 10 kHz. This figure shows the signal collected when the receiver is pointed at the room lights. This signal is entirely noise.
The good choice of player frequencies would be where the noise is low. However, the noise is spread over a lot of the spectrum. So it would be good to reduce the noise if possible.
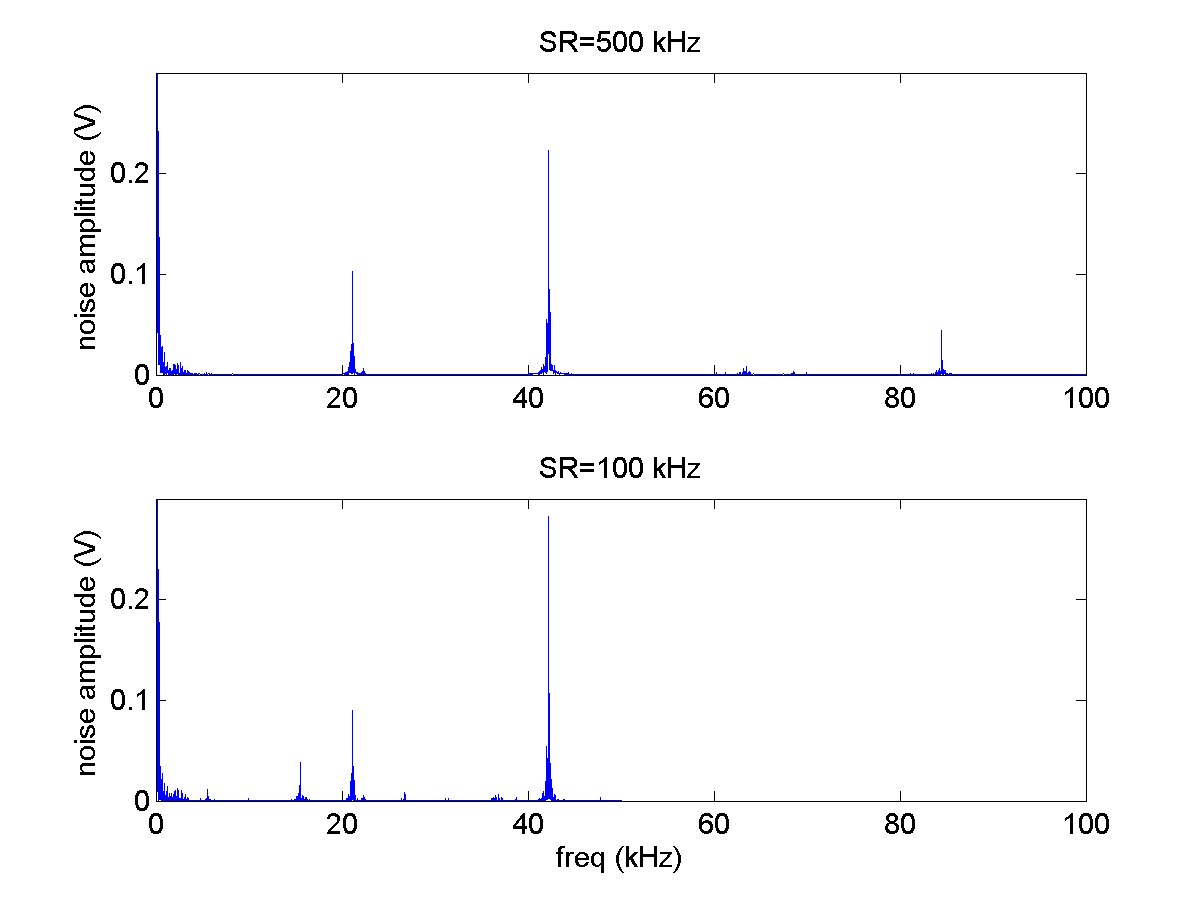
The first step is to determine if the noise has the frequency components shown in the previous plot or if it is an aliased signal. This plot shows the same noise signal collected at sample rates of SR=500 kHz and SR=100 kHz. The signals that line up in frequency are the actual frequencies. As you can see the dominant noise frequencies are around 20 kHz and 40 kHz.
The noise spikes at 20 kHz and 40 kHz need to be eliminated before the signal can be down sampled.


